


Progress tracking in pitching is the systematic process of measuring, recording, and analyzing a young pitcher’s performance to drive continual improvement. Without it, coaches and parents rely on gut feelings instead of facts, and players lose motivation when they can’t see how far they’ve come. Monitoring key metrics like velocity, spin rate, and pitch command gives everyone on the team a shared, objective picture of development. Research confirms that regularly monitoring progress toward goals improves adherence by 20–40% compared to intention alone. That gap between wanting to improve and actually improving is exactly where progress tracking does its best work.
Why use progress tracking in pitching?
Progress tracking in pitching is the difference between a player who grows and one who stagnates. When coaches and parents measure performance consistently, they replace guesswork with evidence. That shift changes everything about how practice is planned and how players respond to feedback.
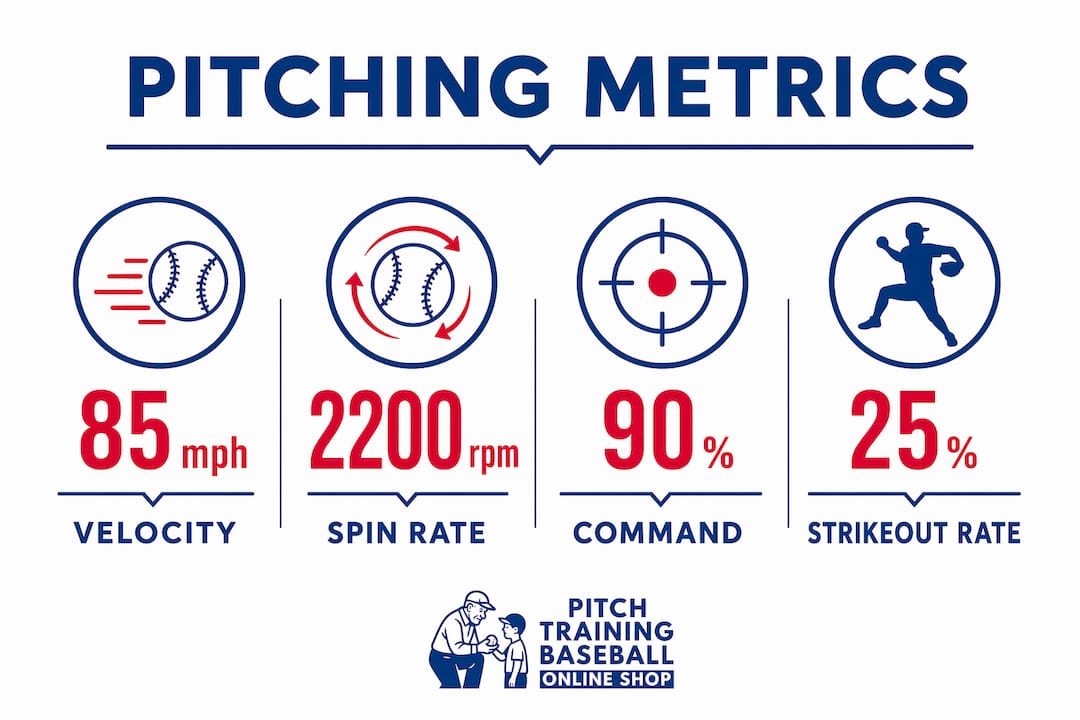
Pitch velocity and spin rate are the two primary performance indicators coaches use to gauge power and pitch effectiveness. Velocity tells you whether a pitcher is building arm strength over time. Spin rate tells you whether the ball is moving in ways that challenge batters, even when velocity is modest.
The importance of pitching metrics goes beyond raw numbers. Metrics give coaches a language to explain what is working and what is not. A young pitcher who hears “your fastball command improved this month” responds differently than one who hears “you pitched better.” Specificity builds confidence and directs effort.
Pitching performance analysis also protects young arms. When coaches track pitching stats, they can spot early signs of fatigue or mechanical breakdown before they become injuries. That protective function alone makes tracking worth the effort for any parent or coach.
Which pitching metrics matter most for tracking youth progress?
The most useful metrics for youth pitchers are the ones that reveal skill development, not just game outcomes. Outcomes like wins and losses depend on teammates and opponents. Skill metrics depend only on the pitcher.
Velocity
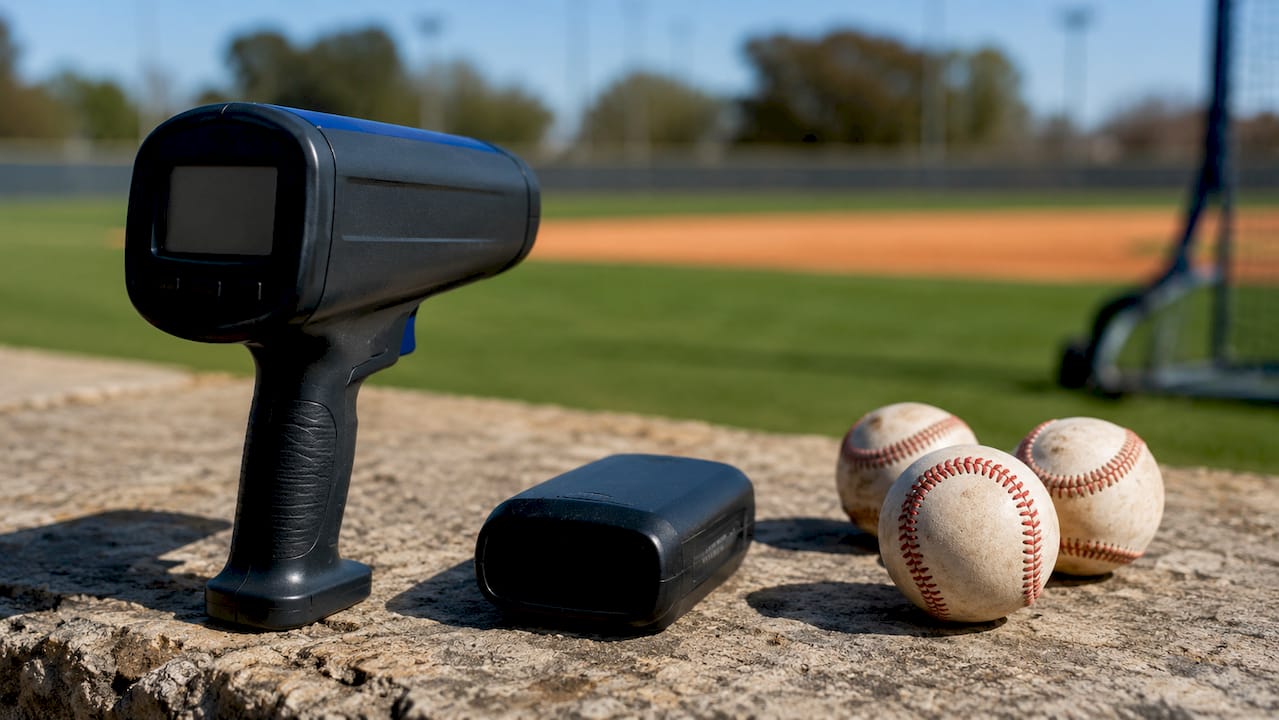
Velocity measures how hard a pitcher throws. For youth players, consistent velocity across an outing matters as much as peak velocity. A pitcher who starts at 62 mph and finishes at 55 mph is showing fatigue. Tracking velocity across multiple sessions reveals whether arm strength is building or declining.
Spin rate
Spin rate measures how fast the ball rotates after release. Higher spin on a fastball creates more rise, making it harder to hit. Tracking spin rate over weeks shows whether a pitcher’s grip and mechanics are improving. Even without advanced radar equipment, coaches can observe spin indirectly through pitch movement patterns.
Pitch command
Pitch command measures location consistency. The Command Delta metric quantifies how consistently a pitcher hits the intended target. It separates skill from luck by measuring where the ball actually goes versus where the catcher sets up. Coaches can learn more about command metrics through Pitchtrainingbaseball’s guide on pitch command for youth baseball.
Strikeout rate and WHIP
Strikeout rate (K%) measures how often a pitcher retires batters via strikeout. Walks and hits per inning pitched (WHIP) measures how many baserunners a pitcher allows per inning. Both stats reflect command and effectiveness, but they need a meaningful sample to be reliable. Strikeout rate stabilizes after roughly 70 batters faced, while ERA requires 630 batters. For youth players, use these stats as directional signals, not definitive grades.
| Metric | What it measures | Why it matters |
|---|---|---|
| Velocity | Pitch speed in mph | Tracks arm strength and stamina over time |
| Spin rate | Ball rotation after release | Indicates pitch movement and deception |
| Command Delta | Location consistency vs. target | Separates skill from luck in pitch placement |
| Strikeout rate (K%) | Strikeouts per batter faced | Reflects overall effectiveness and command |
| WHIP | Baserunners allowed per inning | Measures control and ability to limit damage |
Coaches do not need to track every metric at once. Picking two or three and tracking them consistently over a full season produces far more useful data than measuring everything sporadically.
How does progress tracking motivate young pitchers?
The goal gradient effect is a well-documented principle in performance psychology. Motivation increases as visible progress approaches a goal. When a young pitcher can see that his velocity is up 3 mph from last month, he works harder in the next session. Without that visible marker, effort often fades.
Tracking converts invisible effort into visible evidence. A pitcher who throws 200 bullpen pitches in a week has no way to feel that work unless the numbers reflect it. When they do, the effort feels real and worth repeating.
Weekly accountability reports boost achievement more than writing goals down alone. Sharing progress with a coach or parent adds a social layer that strengthens commitment. A simple weekly check-in where a pitcher reviews his numbers with a coach takes five minutes and produces outsized results.
Tracking also helps coaches make smarter decisions. The Measure-Adjust Loop is the process of using tracked data to identify patterns and then changing the training plan based on what the data shows. Without data, coaches often confuse more practice with better practice. Tracking reveals drill efficacy and helps coaches target the specific areas that need work.
Key benefits of consistent tracking for coaches and parents include:
- Objective feedback: Players receive specific, fact-based feedback instead of vague praise or criticism.
- Early plateau detection: Flat data lines signal when a training approach needs to change.
- Goal alignment: Coaches and players agree on what success looks like before the season starts.
- Reduced conflict: Data replaces opinion when disagreements arise about a player’s progress.
- Increased player ownership: Young pitchers who track their own numbers take more responsibility for their development.
Pro Tip: Keep tracking to three metrics or fewer for players under 14. Too many numbers create confusion and shift focus away from the physical act of pitching.
What are practical methods for tracking pitching progress?
The best tracking method is the one coaches and parents will actually use consistently. Complexity kills consistency, especially across a long season.
Manual logs
A simple notebook or printed template works well for most youth programs. After each bullpen session or game, record velocity (if available), pitch count, and a brief note on command. This takes less than five minutes and builds a reliable record over time. Simple, consistent tracking systems outperform complicated ones that are difficult to maintain, especially with young athletes.
Video analysis
Recording bullpen sessions on a smartphone gives coaches a visual record of mechanics. Comparing video from month to month reveals changes in arm angle, stride length, and release point that numbers alone cannot capture. Video is especially useful for identifying mechanical regressions that precede velocity drops.
Pitch tracking apps
Entry-level pitch tracking apps let coaches log pitch type, location, and result on a tablet during games or bullpens. These apps generate basic heatmaps showing where pitches cluster. A heatmap that shows most pitches landing low and away tells a coach far more than a general sense that “command was off today.”
Pro Tip: Use a simple location heatmap after every bullpen session. Draw a strike zone on paper and mark each pitch location with a dot. After 20 pitches, the pattern tells you everything about command consistency.
Best practices for sustainable tracking:
- Set one or two measurable goals before each session (e.g., “land 70% of fastballs in the lower half of the zone”).
- Record data immediately after the session, not the next day.
- Review data with the pitcher weekly, not just at the end of the season.
- Combine numbers with qualitative notes on effort, attitude, and mechanics.
- Use Pitchtrainingbaseball’s guide on assessing youth pitching performance as a step-by-step framework for structuring reviews.
Measuring pitching success requires patience. One bad outing does not erase a month of progress. Coaches who review data across four to six weeks see trends that single-session reviews miss entirely.
How do you interpret pitching data and adjust training?
Data only helps when coaches know what to do with it. The first distinction to understand is the difference between process metrics and outcome stats.
Process metrics measure what the pitcher controls directly: velocity, command percentage, spin rate. Outcome stats measure results that depend on other factors: ERA, wins, runs allowed. For youth development, process metrics are the ones worth tracking. A pitcher who commands the ball well but gives up runs due to poor defense is still developing correctly.
Pattern recognition is the most valuable skill a coach can develop from tracking data. When a pitcher’s velocity drops in the third inning of every outing, that pattern points to a stamina issue. When command improves on days after rest but declines on back-to-back days, that pattern points to recovery needs. Tracking works best when combined with clear plans and periodic review rather than simply logging data.
| Practice type | Approach | Outcome |
|---|---|---|
| Random practice | No defined goals, varied drills | Inconsistent feedback, slow skill gains |
| Data-driven practice | Specific targets, tracked results | Clear feedback, faster adjustments |
Plateaus are normal in youth pitching development. When data shows no improvement over three to four weeks, that is a signal to change the stimulus, not to practice more of the same thing. Coaches who recognize plateaus early and adjust training keep players developing. Those who ignore flat data lines often push players harder in the wrong direction.
Effective coaching requires balancing quantitative tracking with qualitative insight into player effort and mechanics. Numbers tell you what happened. Observation tells you why.
Key Takeaways
Progress tracking in pitching works because it converts invisible effort into visible evidence, giving coaches and parents the data they need to make smarter training decisions and keep young pitchers motivated.
| Point | Details |
|---|---|
| Track process metrics first | Focus on velocity, command, and spin rate rather than wins or ERA for youth development. |
| Use the goal gradient effect | Visible progress toward a goal increases effort; show players their numbers regularly. |
| Keep systems simple | Three metrics tracked consistently beat ten metrics tracked sporadically. |
| Apply the Measure-Adjust Loop | Use data to identify patterns, then change the training plan based on what you find. |
| Combine data with observation | Numbers show what happened; watching mechanics explains why it happened. |
What I’ve learned from watching coaches track (and not track) youth pitchers
Most coaches I’ve observed fall into one of two camps. The first group tracks nothing and relies entirely on feel. The second group tracks everything and drowns in data they never act on. Neither approach works.
The coaches who get real results from tracking share one habit: they review data with the pitcher, not just about the pitcher. When a 12-year-old sees his own command percentage go from 58% to 71% over six weeks, something clicks. He stops thinking of practice as something adults make him do and starts treating it as something he wants to do. That shift in ownership is the real payoff of tracking.
Parents sometimes worry that introducing metrics will make the game feel like work. My experience is the opposite. Vague feedback (“you need to throw more strikes”) frustrates young players. Specific feedback (“your two-seam fastball hit the target 14 out of 20 times today, up from 9 last week”) gives them something to celebrate and something to aim for.
The biggest mistake I see is abandoning tracking after a rough stretch. Flat or declining data is not a reason to stop measuring. It is the most important time to keep measuring, because that data tells you exactly what needs to change. Consistency in tracking, even through bad weeks, is what separates programs that develop pitchers from programs that just run them through drills.
Start with a notebook and two metrics. Build the habit before you build the system. The data will follow.
— Albert
Training tools that make tracking results easier
Tracking pitching progress works best when practice sessions generate clear, repeatable data. That requires equipment that gives pitchers a defined target to aim at and coaches a consistent reference point to measure against.
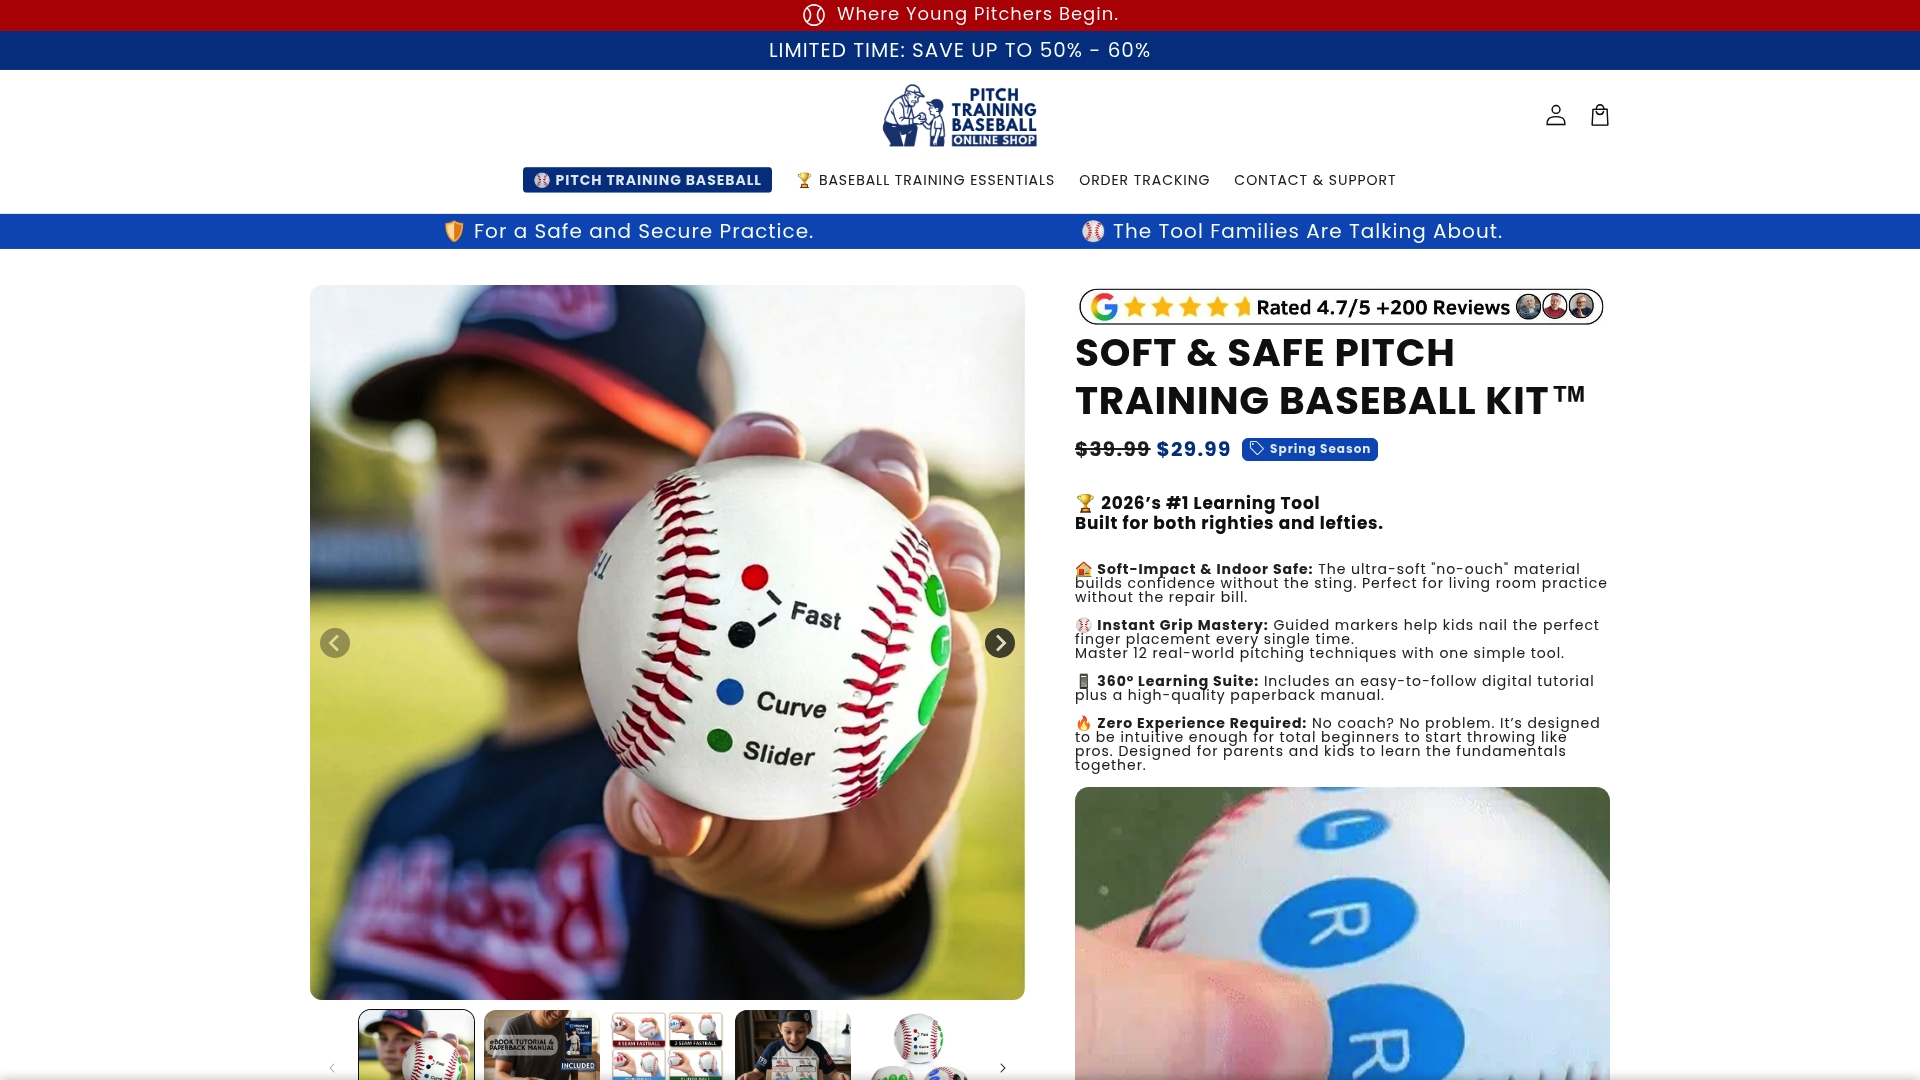
Pitchtrainingbaseball’s 9-zone pitching target net divides the strike zone into nine color-coded sections, giving coaches an instant visual record of where pitches land during every bullpen session. Pair it with the Pitch Training Baseball for consistent, repeatable reps that translate directly into trackable command data. Both tools are portable, easy to set up, and built for the kind of daily practice that makes progress tracking meaningful over a full season.
FAQ
What is progress tracking in pitching?
Progress tracking in pitching is the systematic process of measuring and recording key performance metrics, such as velocity, spin rate, and command, to evaluate and guide a pitcher’s development over time.
Which metrics should youth pitchers track first?
Velocity and command percentage are the best starting points for youth pitchers. Both metrics are easy to measure, directly reflect skill development, and give coaches clear targets for improvement.
How often should coaches review pitching data with players?
Weekly reviews produce the best results. Weekly accountability check-ins boost achievement more than reviewing data only at the end of a season or after poor outings.
Does tracking pitching stats help prevent injuries?
Tracking pitch counts and velocity trends helps coaches spot fatigue patterns before they lead to arm injuries. Monitoring workload alongside performance metrics is a standard injury-prevention practice in youth baseball programs.
How do you track pitching progress without expensive equipment?
A notebook, a stopwatch, and a smartphone camera cover the basics. Record pitch count, estimated velocity, and a location note after each session, then review the pattern weekly to identify trends.
Recommended
- Track pitching stats to protect arms and boost performance – Pitch Training Baseball
- How to assess youth pitching performance step by step – Pitch Training Baseball
- What Is Pitch Trajectory? A Guide for Young Athletes – Pitch Training Baseball
- What Is Pitch Command? A Guide for Youth Baseball – Pitch Training Baseball