


Many talented young pitchers never reach their potential, not because they lack ability, but because the warning signs hiding in their numbers are ignored. Tracking pitch counts prevents arm injuries by monitoring workload and enforcing rest periods, making it one of the most critical habits for youth development. Yet most parents and coaches either skip stat tracking entirely or fixate on the wrong numbers. This guide will show you exactly what to track, how to read the data, and how to use those insights to keep your young pitcher healthy, confident, and steadily improving.
Table of Contents
- The science behind pitching stats: More than just numbers
- Which pitching stats matter most and why
- How to track pitching stats: Tools, techniques, and routines
- Making sense of benchmarks: What good looks like at every age
- Common stat tracking mistakes and how to avoid them
- The real impact of stat tracking: Our perspective after years with youth pitchers
- Elevate your stat tracking with the right training tools
- Frequently asked questions
Key Takeaways
| Point | Details |
|---|---|
| Pitching stats prevent injuries | Tracking pitch counts and key stats helps parents and coaches spot and prevent arm issues before they start. |
| Process stats drive progress | Strike percentage and WHIP are better measures of skill development in young pitchers than ERA alone. |
| Benchmarks guide safe growth | Use age-appropriate ERA, strike %, and velocity benchmarks to set realistic goals and keep kids moving forward safely. |
| Track soreness, not just numbers | Including soreness notes in stat logs helps catch fatigue and avoid preventable injuries for young arms. |
The science behind pitching stats: More than just numbers
Having set the stage on why stat tracking matters, let’s break down exactly what these numbers really tell us and why each deserves your attention.
Numbers in youth baseball often get reduced to wins and losses, but the stats that truly matter run much deeper than that. To protect a young pitcher’s arm and guide real development, you need to understand what each metric is actually measuring and what it can reveal about health, mechanics, and readiness to compete.
Here are the core stats every parent and coach should know:
- Pitch count: The total number of pitches thrown in a game or practice. This is your primary workload indicator and the most direct tool for injury prevention.
- Strike percentage (Strike %): The ratio of strikes thrown to total pitches. A healthy strike % tells you a pitcher has command and isn’t overworking muscles trying to compensate.
- WHIP (walks + hits per inning pitched): A measure of how many baserunners a pitcher allows each inning. A rising WHIP often signals command issues long before ERA climbs.
- ERA (earned run average): The average number of earned runs allowed per nine innings. Useful context, but often misleading for young pitchers.
- Velocity: The speed of the pitch. Relevant for development tracking, but dangerous when prioritized over mechanics.
“Pitch counts are the single most effective tool youth coaches have for protecting growing arms. Once a young pitcher crosses a threshold, the risk of serious injury rises sharply.” Keep that truth posted in your dugout.
Pitch counts and workload are directly tied to reduced injury risk. The stress placed on a developing arm accumulates with every throw, and without a firm count system, overuse injuries become nearly inevitable. What’s interesting is that Strike % and WHIP will often reveal fatigue and command breakdown well before ERA moves at all. A pitcher who normally sits at 65% strikes dropping to 48% over two innings is flashing a red warning light that ERA won’t catch.
Pro Tip: Don’t fixate on ERA when evaluating a young pitcher’s outing. Process stats like strike % and WHIP are far more reliable for development decisions, and they’ll guide your pitching safety tips far better than outcomes alone.
Which pitching stats matter most and why
Once you understand what each pitching stat really measures, it’s critical to know which numbers actually lead to better development and safer arms.
Raw ERA and wins are, frankly, the most overused and misleading stats in youth baseball. ERA in youth leagues is heavily influenced by defensive errors, uneven competition, and small sample sizes. A kid can throw a brilliant outing and post a bloated ERA because of misplays behind him. Conversely, a struggling pitcher with a shaky delivery might get away with a low ERA for a few games just because opponents made poor decisions on the basepaths.
ERA can be skewed by defense, which is why a 10U coach found that his hardest thrower had only 37% strikes and a WHIP above 4.00, making him statistically the least effective pitcher despite looking the most impressive physically. That’s the trap many parents fall into.
Here’s how the key stats stack up for developmental value:
| Stat | What it measures | Developmental value | Limitations |
|---|---|---|---|
| ERA | Earned runs per 9 innings | Low to moderate | Skewed by defense and small samples |
| WHIP | Baserunners per inning | High | Requires tracking walks and hits carefully |
| Strike % | Command and efficiency | Very high | Needs consistent in-game tracking |
| Pitch count | Workload and arm stress | Critical | Must be logged every outing |
| Velocity | Arm strength progression | Moderate | Meaningless without mechanics context |
When evaluating a young pitcher’s outing, walk through this process every single time:
- Check strike % first. Was the pitcher at or above their normal rate? A significant drop signals fatigue or mechanical issues.
- Review pitch count relative to their age-appropriate limit and compare it to prior outings for trends.
- Look at WHIP to understand how many baserunners they allowed. A high WHIP combined with a low pitch count might mean they were hit hard early.
- Note velocity only if you have a reliable way to measure it. Don’t obsess over it, but do log it over time for progression patterns.
Understanding the relationship between proper pitching grip and strike percentage becomes clear when you start tracking these numbers consistently. Coaches who follow pitching coaching tips grounded in process data almost always produce more consistent results than those chasing velocity or wins. Building strike zone knowledge alongside reliable stat tracking gives young pitchers a measurable, repeatable path forward.
How to track pitching stats: Tools, techniques, and routines
Now that you know which stats matter, here’s how you can start tracking them without a coach’s clipboard or fancy technology.
The good news is that you don’t need expensive software to track pitching stats effectively. Several free and low-cost apps exist for mobile devices, including pitching log apps designed specifically for youth players. A simple paper journal or printed scoresheet works just as well for many families. The key is consistency, not technology.
A well-designed weekly pitching log should capture these elements at minimum:
| Date | Opponent/Practice | Pitch count | Strikes thrown | Strike % | Velocity (if tracked) | Soreness noted |
|---|---|---|---|---|---|---|
| April 5 | Game vs. Tigers | 68 | 45 | 66% | 58 mph | Mild forearm tightness |
| April 8 | Practice | 40 | 28 | 70% | 57 mph | None |
| April 12 | Game vs. Eagles | 74 | 47 | 63% | 56 mph | Shoulder fatigue noted |
Logs combining pitch counts, strikes, velocity, and soreness notes enable parents and coaches to spot fatigue early and adjust training before any real damage is done. Notice in the table above how velocity dipped slightly by April 12 while the pitch count was higher and soreness was reported. That’s a signal to reduce workload for the next 5 to 7 days.

Little League regulates pitch counts with clear maximums: 75 pitches for ages 9 to 10, 85 for ages 11 to 12, and 95 for ages 13 to 16, with mandatory rest days that scale based on how many pitches were thrown. These aren’t suggestions. They are evidence-based limits designed to protect growth plates and developing connective tissue.
Here are common routines that work well for real families and coaching staffs:
- Assign a dedicated pitch counter at every game, whether a parent in the stands or an assistant coach.
- Record stats within 30 minutes of the outing, while details are fresh.
- Review the log together with your pitcher once a week. Make it a conversation, not a critique.
- Track practice sessions too, especially bullpen work. Many coaches overlook practice throws when calculating weekly arm stress.
Pro Tip: Add a soreness column to every log entry. Numbers alone won’t catch every warning sign. A pitcher who mentions elbow tightness after 60 pitches is telling you something critically important that won’t show up in strike percentage.
Once your tracking routine is solid, use the data to adjust pitching practice routines accordingly. Here’s how the data should guide your adjustments:
- Strike % below 50%: Focus practice on command drills and target work, not velocity training.
- Pitch count trending up game to game: Reduce practice volume that week and prioritize recovery.
- Velocity dropping more than 3 mph: Consider a rest period and review mechanics to fix pitching mistakes before the next outing.
- Consistent soreness in the same location: Stop. Consult a sports medicine professional immediately.
Making sense of benchmarks: What good looks like at every age
After establishing your tracking method, the next step is learning how to interpret the numbers, especially what’s average versus excellent for each age bracket.
Benchmarks give you a compass. They tell you whether a pitcher’s current stats are realistic, concerning, or genuinely strong for their developmental stage. Without benchmarks, it’s easy to either panic over normal variation or miss genuine red flags.
Here’s a reference table to keep in your coaching binder:
| Age group | ERA target | Strike % target | Average velocity |
|---|---|---|---|
| 8U | Under 3.00 | 50% or higher | 30 to 40 mph |
| 10U | Under 2.50 | 50% or higher | 40 to 50 mph |
| 12U | Under 2.00 | 60% or higher | 45 to 55 mph |
| 14U | Under 1.50 | 62% or higher | 55 to 65 mph |
| High school | Under 1.00 (elite) | 65% or higher | 65 to 80 mph |
ERA benchmarks for youth games account for the shorter inning format typical in recreational leagues. Strike % targets rise with age because command improves naturally as motor patterns develop and pitchers spend more time mastering their delivery.
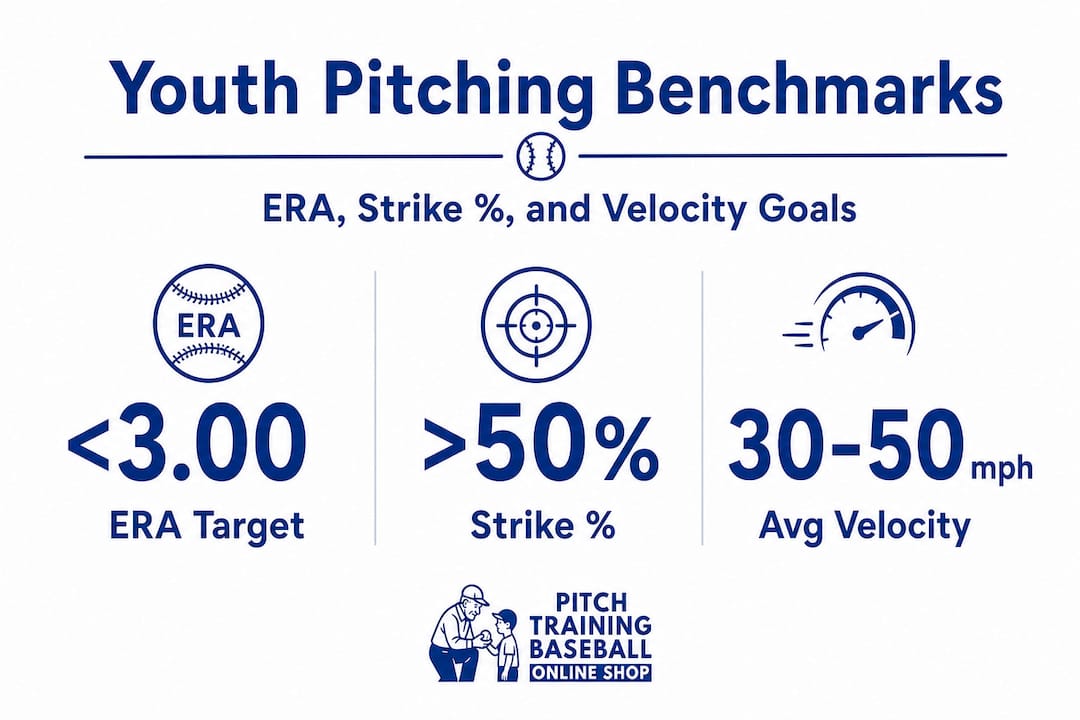
Velocity benchmarks matter too, but only in context. Average velocities for ages 9 to 12 range from 40 to 55 mph, climbing to 55 to 70 mph for ages 13 to 15. These are wide ranges intentionally, because healthy velocity growth varies based on body size, mechanics, and training history.
Here’s how to use benchmarks practically rather than as pressure points:
- If your pitcher is above benchmark: Excellent. Keep the current training approach, monitor workload closely to avoid overuse, and start introducing advanced concepts like secondary pitches only after mechanics are completely solid.
- If your pitcher is at benchmark: You’re on the right track. Look for two or three specific areas to sharpen, whether that’s consistency in early counts or reducing walks, and build a short-term goal around that.
- If your pitcher is below benchmark: Don’t panic. Dig into which specific stat is the weakest. A pitcher well below on ERA but strong in strike % may just be pitching in a tough league or behind a shaky defense. A pitcher well below on strike % needs focused command work immediately.
The healthiest way to use benchmarks is as a long-term progress tool, not a weekly report card. Young athletes develop at wildly different rates, and a 10-year-old who sits below the strike % target in April may clear it comfortably by August with the right practice structure.
Common stat tracking mistakes and how to avoid them
Understanding benchmarks is important, but many parents and coaches stumble by misusing or misinterpreting stats. Here’s how to avoid those traps.
The most damaging mistakes in youth stat tracking often come from good intentions applied poorly. Parents want their child to succeed. Coaches want to win games. But when stats are misused, they create pressure instead of progress and can accelerate exactly the injuries and burnout they were meant to prevent.
Watch out for these common pitfalls:
- Focusing only on ERA and wins. These outcome stats are the least reliable for evaluating youth pitcher development. As college coaches prioritize velocity, strike %, and mechanics over ERA when evaluating recruits, your tracking should reflect those same priorities far earlier.
- Chasing velocity over mechanics. Tracking velocity is fine. Pushing a 12-year-old to throw harder before their mechanics are locked in is how growth plate injuries happen. Velocity should be a byproduct of good mechanics, never a primary goal.
- Skipping rest data. If you track pitch counts but ignore mandatory rest periods, the count itself becomes meaningless. Rest days are not optional recovery, they are when the arm actually repairs itself.
- Tracking inconsistently. One game logged, two games skipped, then a burst of entries makes trend analysis impossible. Spotting fatigue patterns requires consistent data over multiple outings.
- Using numbers as pressure tools. Showing a young pitcher their stats to criticize performance is one of the fastest ways to kill confidence and love of the game. Stats should start conversations, not end them.
- Ignoring throwing techniques in favor of pure stat review. Numbers reveal symptoms; mechanics are usually the root cause.
Pro Tip: Frame every stat conversation with your pitcher around improvement, not judgment. Instead of “Your strike % was only 52% today,” try “Your strike % was 52% today. Let’s figure out what we can do in practice this week to push that closer to 60%. That’s a realistic goal.” That shift in framing changes everything.
When injuries and performance plateaus hit young pitchers, inconsistent or misguided stat tracking is frequently part of the story. The arm doesn’t lie. The data doesn’t lie either, but only if you’re collecting it honestly and interpreting it with the pitcher’s long-term health as the top priority.
The real impact of stat tracking: Our perspective after years with youth pitchers
Stepping back, our real-world experience with countless youth pitchers highlights what textbooks and apps often miss about stat tracking’s deeper value.
Here’s a truth that might surprise you: the biggest obstacle to stat tracking in youth baseball isn’t a lack of technology or even a lack of time. It’s a mindset problem. Most parents and coaches either believe stat tracking is only for elite programs or worry that numbers will add pressure to an already stressful environment for kids. Both concerns are understandable. Both are wrong.
The teams and families we’ve seen benefit most from stat tracking are not the ones with the fanciest apps or the most detailed spreadsheets. They’re the ones who made it a quiet, consistent habit. A parent in a folding chair counting pitches and jotting down a strike tally. A coach who spends five minutes after each outing logging notes on soreness and energy level. That simple routine, repeated over a full season, builds an extraordinarily detailed picture of how a young pitcher is developing.
One of the most eye-opening things consistent stat logs reveal is compensated mechanics. This happens when a pitcher is fatigued but pushes through. Their body unconsciously changes the delivery to protect a sore spot, usually introducing shoulder or elbow stress in a new place. The stats show it before any physical symptom appears. Velocity drops two to three mph. Strike % falls below normal. Walk rate climbs. The log says something is wrong before the kid says anything, because kids almost never voluntarily report discomfort when they want to keep pitching.
Process stats are the unsung heroes of youth development. Strike percentage, WHIP, and pitch count efficiency are not glamorous. They won’t be displayed on a scoreboard or featured in a highlights reel. But they are the numbers that tell you whether a kid is building the right habits, maintaining stamina deep in games, and developing command at a healthy rate. ERA gets all the attention. Process stats do all the real work.
Confidence is the other side of this equation that rarely gets discussed. When a young pitcher and their parent sit down and look at a log showing strike % improving from 51% to 63% over the course of a season, something meaningful happens. The kid sees that practice is producing measurable results. The parent sees that their time and investment are paying off. Both have a reason to stay committed through the rough outings that every pitcher experiences. Numbers, used encouragingly, build resilience.
The hardest lesson we’ve internalized over the years is that stats should never become weapons. The moment a parent or coach uses a stat to embarrass, criticize harshly, or shame a young athlete, they’ve broken something that’s very hard to rebuild. Data is a tool for education and encouragement. Every number in that log is an opportunity to guide, not judge.
Elevate your stat tracking with the right training tools
Ready to turn tracking into real results? The right tools can make all the difference on the path from numbers to next-level performance.
Stat tracking reveals what to fix. Training tools are how you fix it. If your data shows a drop in strike percentage, targeted practice with a pitching target net gives your young pitcher immediate visual feedback on command with every rep. If pitch count efficiency is the concern, the right training approach using a pitch training baseball can reinforce proper mechanics and reduce wasted pitches over time.
At Pitch Training Baseball, our products are built specifically for the youth athlete, designed to be portable, adjustable, and easy to set up for both backyard sessions and organized practices. When your tracking data points to a specific weakness, our training tools give you a focused, practical way to address it at practice. That connection between the numbers and the work is where real improvement lives. Start building that bridge today.
Frequently asked questions
Which pitching stats should youth coaches and parents track first?
Start with pitch counts, strike percentage, and WHIP. These stats reveal command issues and workload problems far more reliably than ERA and are the most actionable for development decisions.
How does stat tracking help prevent youth pitching injuries?
Consistent tracking makes it easier to spot fatigue trends and enforce rest periods before overuse damage occurs. Monitoring pitch counts and workload is one of the most proven methods for protecting developing arms.
What are healthy pitching benchmarks for 10U and 12U players?
For 10U, target an ERA under 2.50 and a strike percentage above 50%. At 12U, aim for ERA under 2.00 and a strike percentage near 60% to stay on track developmentally.
What’s the recommended maximum pitch count for youth ages 9 to 12?
Little League sets the limit at 75 pitches for ages 9 to 10 and 85 for ages 11 to 12. These pitch count rules also require mandatory rest days based on how many pitches were thrown in a given outing.
Should I worry if my child throws slower than peers?
No. Mechanics and control are far more important at young ages than speed. Average youth velocities range widely from 40 to 55 mph for ages 9 to 12, and healthy progression comes from consistent, mechanically sound practice rather than pushing for maximum speed.