


Your pitcher throws a shutout one Saturday and walks six batters the next. You’re left wondering: is this a development issue, a bad day, or something you should actually fix? This confusion is one of the most common challenges coaches and parents face when trying to evaluate young pitchers. Without a structured approach, it’s easy to overreact to a single bad outing or miss a real pattern that needs attention. This guide gives you clear, practical steps to assess pitching performance accurately, track the metrics that matter most, and turn your observations into a real development plan that builds better pitchers over time.
Table of Contents
- Gather the right tools and information
- Step-by-step: Core pitching metrics to track
- Spot mechanical strengths and address common mistakes
- Turn performance data into a development plan
- A smarter way to judge improvement: What most miss about youth pitching
- Tools to help you assess and train pitchers better
- Frequently asked questions
Key Takeaways
| Point | Details |
|---|---|
| Focus on trends | Track multiple outings, not just one game, to see real pitching progress. |
| Use simple tools | Scorebooks, apps, or pitch counters can capture all the data needed. |
| Metrics and mechanics | Analyze both stats and body mechanics to understand true performance. |
| Develop with data | Turn performance tracking into clear goals and customized training steps. |
| Prevention matters | Watch for fatigue and adjust workloads to keep young pitchers healthy. |
Gather the right tools and information
Let’s start by setting up your assessment with the right tools and information.
Before you can assess anything, you need a reliable system for capturing what actually happens on the mound. Most coaches and parents skip this step and rely on memory, which is where evaluations go wrong. Memory is selective. It tends to hold onto dramatic moments, either a great strikeout or a bases-loaded walk, while blurring the quieter details that paint the real picture.
Consistent measurement is the foundation of honest assessment. The goal isn’t to judge performance from a single game but to build a picture across multiple outings. Velocity can drop on a cold day. Accuracy suffers when a player is nervous. One rough inning in a longer season tells you very little on its own. But when you see that velocity has dropped three games in a row, or that walk rates are climbing every time the team falls behind, that’s meaningful data you can actually use.
Here’s the good news: you don’t need expensive technology to start. A simple scorebook, a free pitch counter app, or even a notebook with a consistent format gives you everything you need to track the numbers that matter.
Essential tools for pitcher assessment:
- A pitch counter or clicker (manual or phone app)
- Scorebook or simple tracking sheet
- Stopwatch or radar gun (optional but helpful for velocity)
- Video camera or phone for mechanical review
- A consistent template for each outing (date, opponent, conditions, stats)
Even without a radar gun, you can track relative velocity changes by timing pitches from release to the catcher’s glove using slow-motion video. It’s not a perfect system, but it gives you directional data, which is often enough to spot trends.
| Tracking tool | What it measures | Cost level |
|---|---|---|
| Pitch counter app | Pitch count per game | Free |
| Scorebook | Strikes, balls, hits, walks, outs | Low |
| Phone camera (slow-mo) | Mechanics, arm path, release | Free |
| Radar gun | Actual pitch velocity | Medium to high |
| Wearable sensor | Arm stress, spin rate | High |
Collecting basic stats from every outing builds the trend data you’ll need later. Focus on pitch count, strike percentage, walk total, strikeout total, and any notes about conditions or visible fatigue. These six data points alone reveal more than most people realize.
Pro Tip: Use a free app like GameChanger or a simple Google Sheets template to log each outing. After four to five games, you’ll start seeing patterns that would never show up if you relied on memory alone.
The reason trends matter so much is backed by pitching data research. Average pitch velocity and performance benchmarks should be assessed across multiple outings, because single-game data is too influenced by outside factors like weather, fatigue, and opponent quality to be reliable on its own.
Building habits around game-like pitching practice also means your data from practice sessions becomes more useful. If a pitcher throws well under simulated pressure in practice but struggles in games, that gap itself is a performance insight.
Strong pitching zone knowledge is another area you can track without technology. Simply note whether the pitcher is hitting their intended zone, not just whether the umpire calls a strike.
Step-by-step: Core pitching metrics to track
With your tools ready, let’s look at the core metrics that reveal true pitching progress.
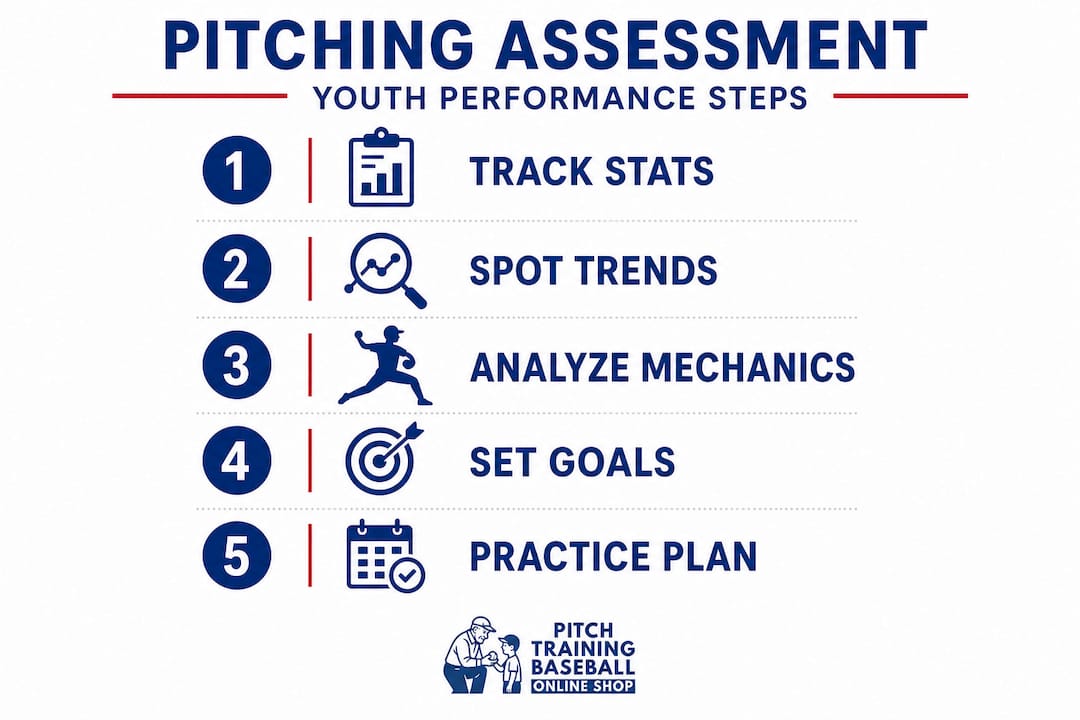
Not all stats are equally useful at the youth level. ERA (earned run average) is popular, but it’s heavily influenced by fielding errors behind the pitcher, which are common in youth baseball. Strikeout rate and walk rate tend to be far more honest measures of pitcher performance because they reflect only what the pitcher controls.
Here’s a step-by-step approach to tracking the metrics that matter most:
-
Record pitch count per inning and per game. This is your first safety check. Most youth organizations follow pitch count limits by age, and tracking this prevents overuse injuries before they start.
-
Calculate strike percentage. Divide total strikes thrown by total pitches. A consistent strike percentage above 60 percent is a solid target for youth pitchers. Below 50 percent signals a control problem worth addressing.
-
Track walk rate per inning. More than one walk per inning over multiple games suggests consistent control issues that need mechanical or mental attention.
-
Log strikeout-to-walk ratio. A ratio above 2:1 (two strikeouts for every walk) is a positive indicator at the youth level. This number tells you whether the pitcher is dominating contact or just surviving it.
-
Note velocity trends. Even without a radar gun, you can judge relative velocity from game to game. A pitcher who looks “slower” than usual three games in a row may be fatigued or dealing with an arm issue.
-
Track first-pitch strike rate. Pitchers who throw a first-pitch strike more than 60 percent of the time tend to throw fewer pitches, give up fewer walks, and get more outs. It’s one of the most predictive single metrics at any level.
| Metric | What it reveals | Youth target range |
|---|---|---|
| Strike percentage | Command and control | 60%+ |
| Walk rate | Control consistency | Under 1 per inning |
| K/BB ratio | Dominance vs. survival | 2:1 or better |
| First-pitch strike rate | Count management | 60%+ |
| Velocity trend | Fatigue, arm health | Stable or improving |
| Pitch count per game | Workload and endurance | Age-based guidelines |
Important context here: performance benchmarks at the youth level should be interpreted as trend-based goals, not pass-fail tests for any single outing. A 10-year-old who averages 55 percent strikes over six weeks is making real progress, even if any individual game looks messy.
Pro Tip: Avoid the trap of fixating on a single brilliant outing. If a pitcher strikes out eight batters one game, that’s exciting. But if their walk rate was still high and their pitch count was through the roof, there’s still work to do. Look at the pattern, not the highlight.
Two areas that often need direct attention based on metric review are fixing pitching mistakes related to command and refining throwing technique to improve consistency at the release point. Both of these feed directly into the numbers you’re tracking.
Spot mechanical strengths and address common mistakes
Once you’re tracking stats, step back to observe the body language and motions behind the numbers.

Numbers tell you what is happening. Mechanics tell you why. A high walk rate might come from a hitch in the arm path, poor stride direction, or inconsistent release point. You can’t fix the number without finding the mechanical cause.
Key mechanical checkpoints to observe during each outing:
- Balance point: Is the pitcher holding a balanced, controlled leg lift before moving toward the plate? Early hip drift destroys command.
- Stride direction: Is the foot landing toward the target, or is it opening up too early? An open stride causes pitches to sail high and away.
- Arm angle: Is the arm slot consistent from pitch to pitch? Changing arm angles, especially when tired, leads to unpredictable movement and extra stress on the elbow.
- Hip-shoulder separation: Are the hips rotating ahead of the upper body? This is one of the biggest velocity generators, and it often disappears when a young pitcher is fatigued.
- Follow-through: Does the arm finish across the body in a controlled, repeatable motion? A short follow-through is often a red flag for future arm trouble.
- Glove-side control: Is the glove tucking in or flying out? A flying glove pulls the shoulder open early and kills accuracy.
“The mechanics of a young pitcher are a snapshot in time. The real insight comes from watching whether those mechanics hold up as pitch counts climb and fatigue sets in. That’s when you learn what needs the most work.”
Fatigue is one of the most overlooked contributors to mechanical breakdown. Trend-based observation across outings lets you see whether mechanics stay consistent or start to deteriorate as the game progresses. A pitcher who looks sharp through three innings but falls apart in the fourth is likely hitting a conditioning wall.
Common mechanical mistakes in youth pitchers and their quick corrections:
- Flying open too early: Cue the pitcher to keep the front shoulder closed and pointing at the target longer during the wind-up.
- Dropping the elbow: Use drills that emphasize throwing from the top of the shoulder. Wrist weight exercises can reinforce proper arm slot.
- Rushing the delivery: Slow the tempo down in bullpen sessions. Deliberate, controlled practice at slower speeds builds better habits than always going full effort.
- Poor balance: Add single-leg balance drills to warm-up routines. Strong balance translates directly to a more repeatable delivery.
Developing strong pitching balance is one of the fastest ways to improve mechanical consistency. Combine that with proper pitching grip fundamentals, and you address two of the biggest root causes of accuracy problems in young pitchers.
Film review is a powerful tool here. Even a phone video from behind the catcher or from the first-base side gives you enough footage to spot arm angle changes and stride issues that are invisible from the dugout. Watch the same pitcher across three or four games and look for what changes when they’re tired or struggling.
Turn performance data into a development plan
Now that you understand what to observe, here’s how to use the insights to advance your athlete’s development.
Data without action is just numbers in a notebook. The real value of pitcher assessment comes when you translate what you’ve observed into a focused training plan. This is where coaches and parents can make a genuine difference in a young pitcher’s growth.
Here’s a step-by-step process for turning your assessment data into a real development plan:
-
Review the trend data from the last three to five outings. Look for the two or three metrics that show the most room for improvement. Don’t try to fix everything at once. Young pitchers can only focus on one or two things at a time, and overloading them with corrections actually slows progress.
-
Identify whether the issue is mechanical, mental, or conditioning-related. A pitcher who walks batters in tight situations but throws well in empty bullpen sessions has a mental challenge, not a mechanical one. A pitcher whose velocity drops by the third inning has a conditioning issue. Match the solution to the actual problem.
-
Set a specific, measurable goal for the next three to four weeks. “Improve command” is too vague. “Increase first-pitch strike rate from 48 percent to 58 percent” is a real target. Specific goals create accountability and make progress visible.
-
Build practice sessions around those goals. If walk rate is the target metric, prioritize bullpen sessions that focus on zone control, not maximum velocity. Use target-based practice to train the pitcher’s eye and release point simultaneously.
-
Schedule a check-in after every two to three games. Update your tracking sheet and look at whether the targeted metrics are moving in the right direction. Benchmarks and performance decisions work best when reviewed as trends, so give the changes at least a few outings before deciding whether to adjust the plan.
-
Know when to recommend rest or a position change. If velocity has dropped noticeably and mechanics are breaking down, that pitcher may need a week off from throwing entirely. Coaches who ignore these signals are the ones dealing with elbow injuries three months later. A short rest now protects a long career.
Tracking progress keeps players motivated. When a pitcher can see that their strike percentage went from 52 to 63 percent over six weeks, that’s visible evidence of real growth. It reinforces that the practice work is paying off and builds the kind of intrinsic motivation that outlasts any trophy.
Combining consistent data review with focused drills drawn from solid pitching technique resources creates a development loop that actually compounds over time. Each assessment informs the next round of practice, and each round of practice shows up in the next assessment.
Practicing under game-like conditions is the bridge between bullpen numbers and real game performance. Training in isolation produces isolated improvement. Training in realistic, pressure-simulating conditions builds the kind of adaptable skill that holds up in competition.
Pro Tip: Celebrate small wins explicitly and out loud. When a pitcher improves their first-pitch strike rate by even five percent, name it and acknowledge the effort behind it. Young athletes who feel recognized for process improvements stay engaged in the grind of development far longer than those who only hear about it when results show up in the box score.
A smarter way to judge improvement: What most miss about youth pitching
Here’s a perspective that most coaching resources won’t tell you directly: the biggest mistake coaches and parents make isn’t tracking the wrong stats. It’s expecting too much clarity from short windows of data.
Youth pitching development is fundamentally nonlinear. A 12-year-old who looks inconsistent over one month might be going through a growth spurt that temporarily disrupts their coordination and mechanics. A pitcher who seems to plateau for six weeks might be quietly internalizing a new delivery pattern that hasn’t shown up in the numbers yet. If you judge development only by recent outcomes, you’ll misread what’s actually happening.
The research is consistent on this point: single-outing performance is too noisy to use as a reliable benchmark. Velocity changes. Fatigue compounds. Emotional stakes vary from game to game. Trend-based evaluation is simply more honest, and more useful.
What separates coaches who consistently develop elite-level pitchers from those who don’t is usually not access to better training equipment or more practice time. It’s the quality of observation and communication. The coaches who make the biggest difference are the ones who watch carefully over time, ask thoughtful questions after outings, and give young pitchers the language to understand their own performance.
Regular, honest conversation between coach, parent, and player is one of the most underused development tools in youth baseball. When a pitcher can articulate why they struggled in the third inning or what felt different when they were hitting their spots, they’re building the self-awareness that eventually allows self-correction. That’s a skill that no drill can teach on its own.
Investing in consistent game-like pitching practice environments supports this kind of self-awareness by giving pitchers repeated, structured opportunities to test adjustments under realistic conditions. Assessment and practice should feed each other continuously.
The takeaway is simple but easy to forget during a frustrating game: a growth mindset, grounded in honest trend observation and supportive feedback, predicts long-term pitching success better than any single performance metric ever will.
Tools to help you assess and train pitchers better
Ready to put your assessment plan into action? Here are trusted tools to help you get started.
Having the right equipment turns good assessment intentions into real results. When you know exactly what you’re working on from your data review, targeted training tools let you build focused, effective sessions that address the gaps you’ve identified.
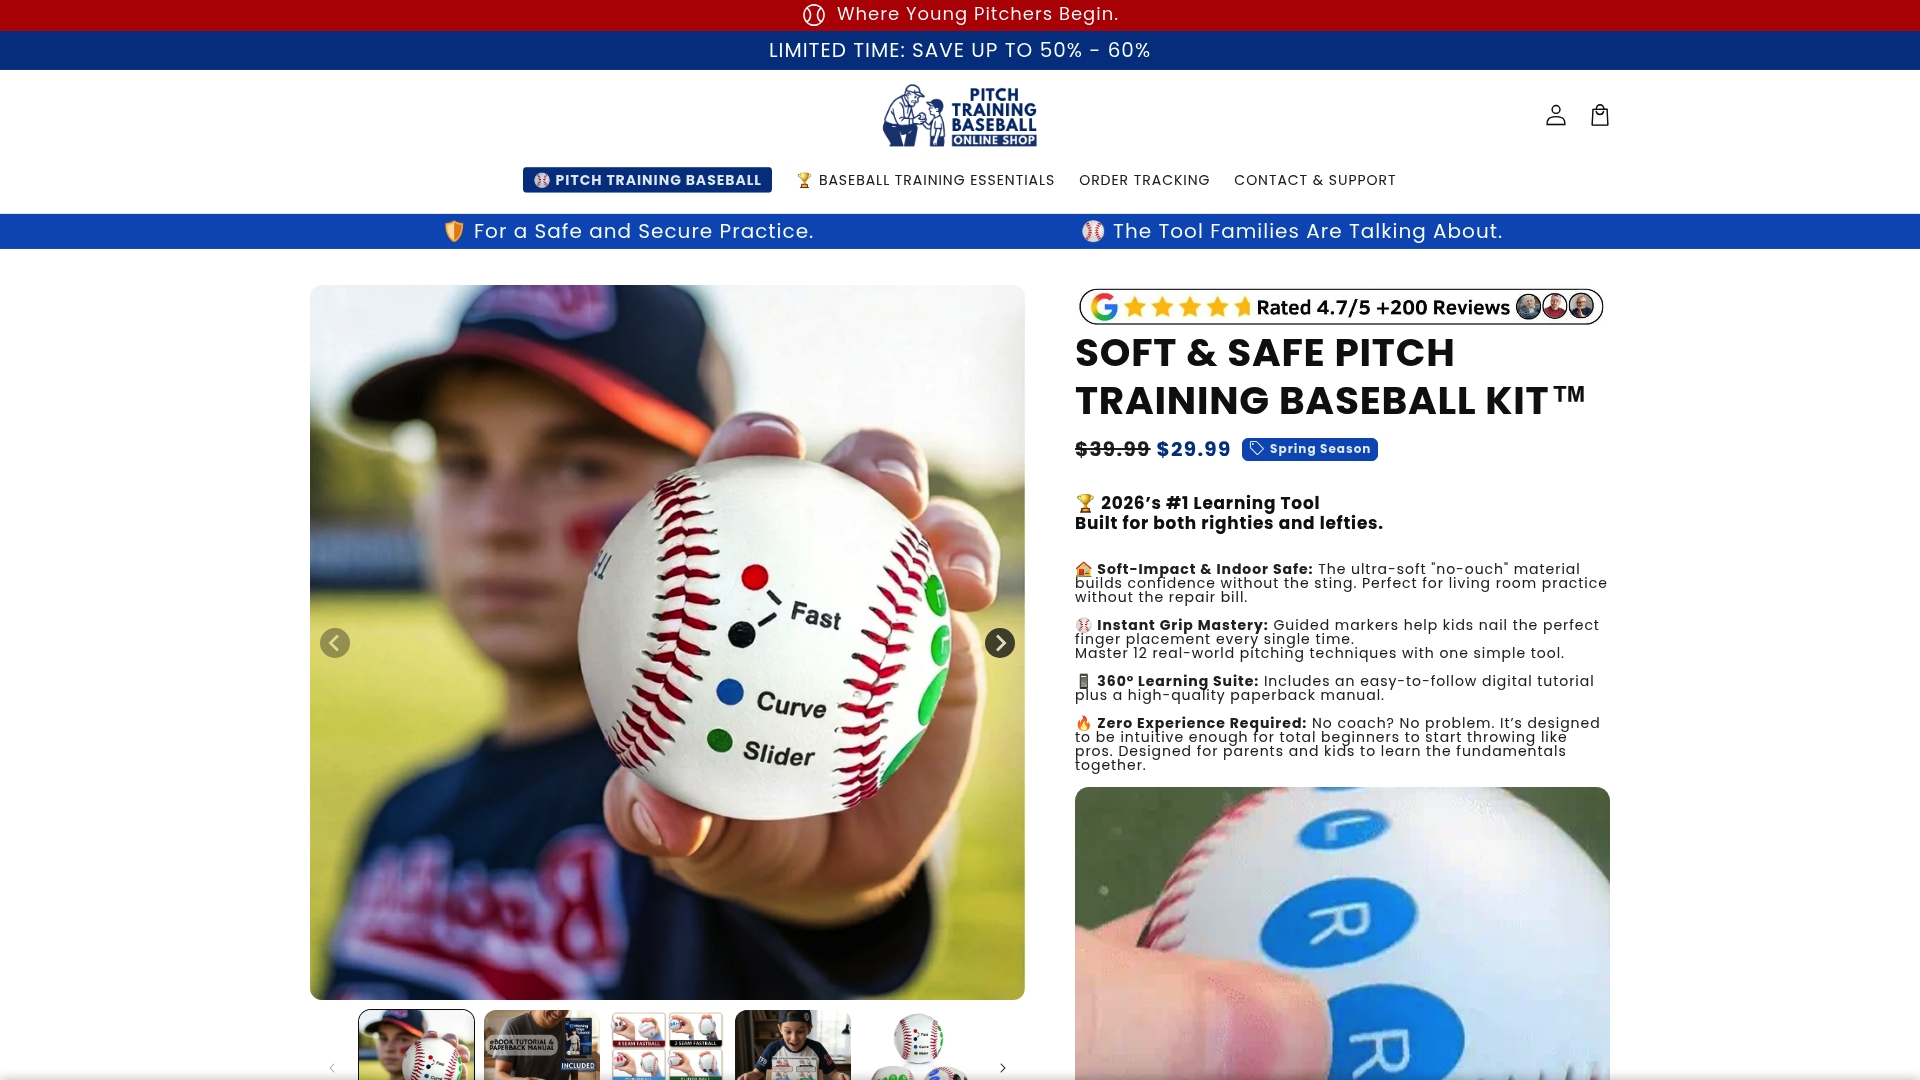
Our pitch training baseball is designed to give pitchers instant feedback on grip, spin, and release, making it a natural fit for players working on command and consistency. If your assessment shows accuracy or zone control is the priority, the pitching target net with strike zone creates a visible, measurable target that turns every bullpen rep into a data point. For athletes working across both baseball and softball, the pitch training softball option brings the same structured approach to a wider group of developing players. These tools are built for the exact kind of consistent, purposeful practice that moves the metrics you’re tracking.
Frequently asked questions
What is the most important pitching stat for youth players?
Consistency across outings and gradual improvement in multiple areas matter more than any single stat. Single-game data is too influenced by external variables to be a reliable indicator of true development progress.
How often should I assess my pitcher’s performance?
Assess after each outing but reserve judgments for trends across several games or weeks. Trend-based benchmarks give you a much more accurate read on whether development is actually moving forward.
What basic tools do I need to track pitching performance?
A notebook or free app for stats, a pitch counter, and regular access to game or bullpen sessions are all you need to start building the trend data that drives real development decisions.
How do I know if a young pitcher is being overworked?
Watch for declining velocity, deteriorating accuracy, or visible signs of mechanical fatigue over consecutive outings. Fatigue-related changes in velocity and movement consistency are early warning signs that rest is needed before an injury occurs.
Can mechanics change from game to game?
Yes, mechanics fluctuate naturally due to fatigue, growth spurts, and competitive pressure. Tracking mechanical trends across multiple outings helps you separate one-off variations from patterns that actually need to be corrected.
Recommended
- Fix youth pitching mistakes for better performance – Pitch Training Baseball
- How to throw a baseball: proven youth coaching tips – Pitch Training Baseball
- Game-like pitching practice: Raise youth baseball skills fast – Pitch Training Baseball
- How to improve baseball throwing: techniques and tools – Pitch Training Baseball